+1-440-204-2100

Menu
Crime Statistics

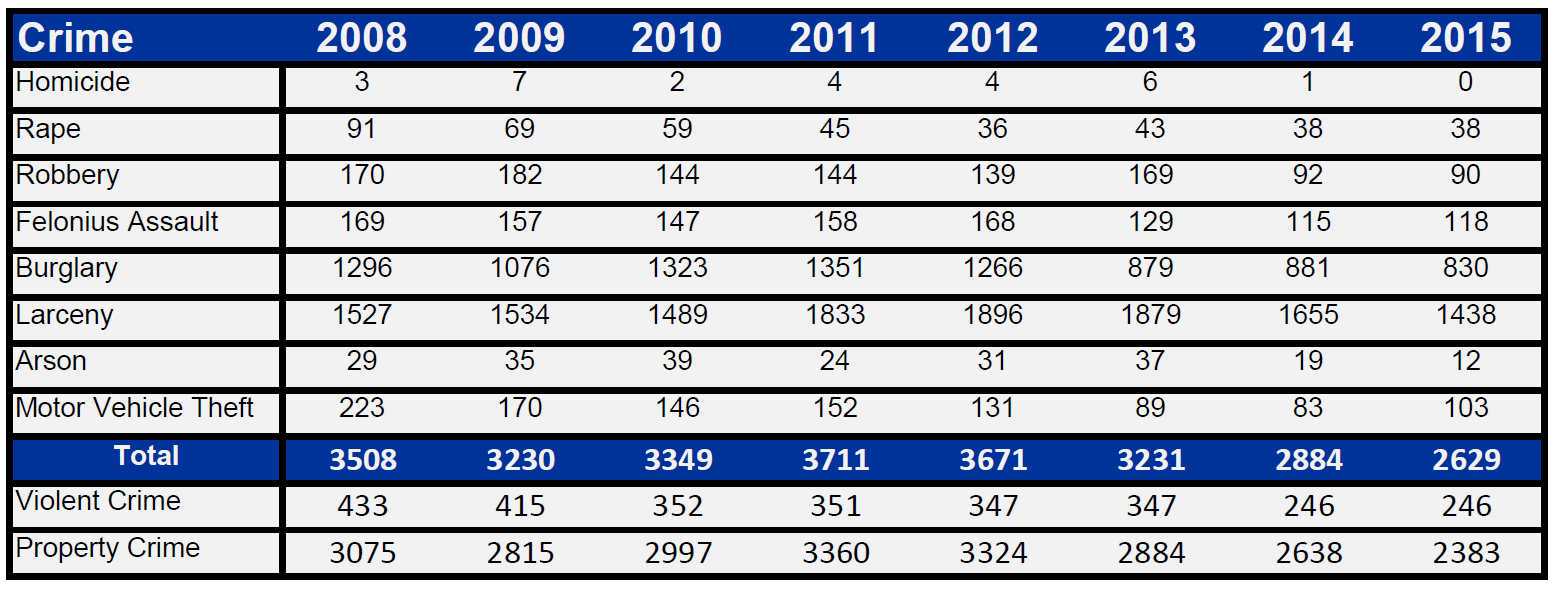
The following information reflects only crimes that are categorized as Part I Crimes by the FBI’s Uniform Crime Report. By the FBI’s definition, Part I Crimes include homicide, rape, robbery, aggravated assault, burglary, larceny, motor vehicle theft, and arson. The numbers reported here reflect the official Part I Crime numbers reported to the FBI and exclude cases that have been unfounded.

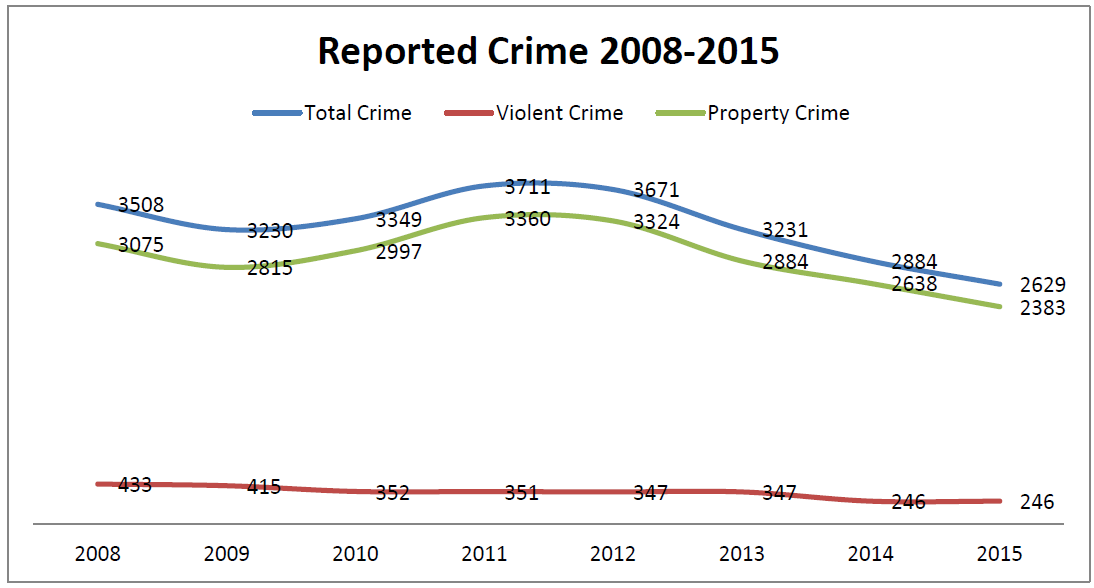
In 2015, Lorain had 2,629 reported Part I crimes, a 8.8% decrease from 2014 (2,884). More specifically, violent crime (comprised of homicide, rape, robbery, and aggravated assault) remained statistically the same while property crime (comprised of burglary, larceny, motor vehicle theft, and arson) decreased by approximately 9.7% from 2014 to 2015.

*General Part I UCR Offenses, not official FBI UCR numbers.  Data may be subject to change.

It is of particular note that the overall reported crime has been reduced nearly 30% in just four years.  In 2011, which was the year we experienced the highest reported crime rate in nearly ten years, there were 3,711 overall reported Part I crimes in the city of Lorain.  In that year, the Lorain Police Department adopted an Intelligence Led Policing model of enforcement.  Since our adoption of that strategy, we have managed to steadily (and sometimes drastically) reduce overall crime year over year in the city of Lorain.  As mentioned above, in 2015 there were 2,629 reported Part I crimes in the city, representing a 29.2% decrease in overall crime in just four years.  Since 2008, we have reduced overall violent Part I crimes by over 43% in the city of Lorain.

*General Part I UCR Offenses, not official FBI UCR numbers.  Data may be subject to change.

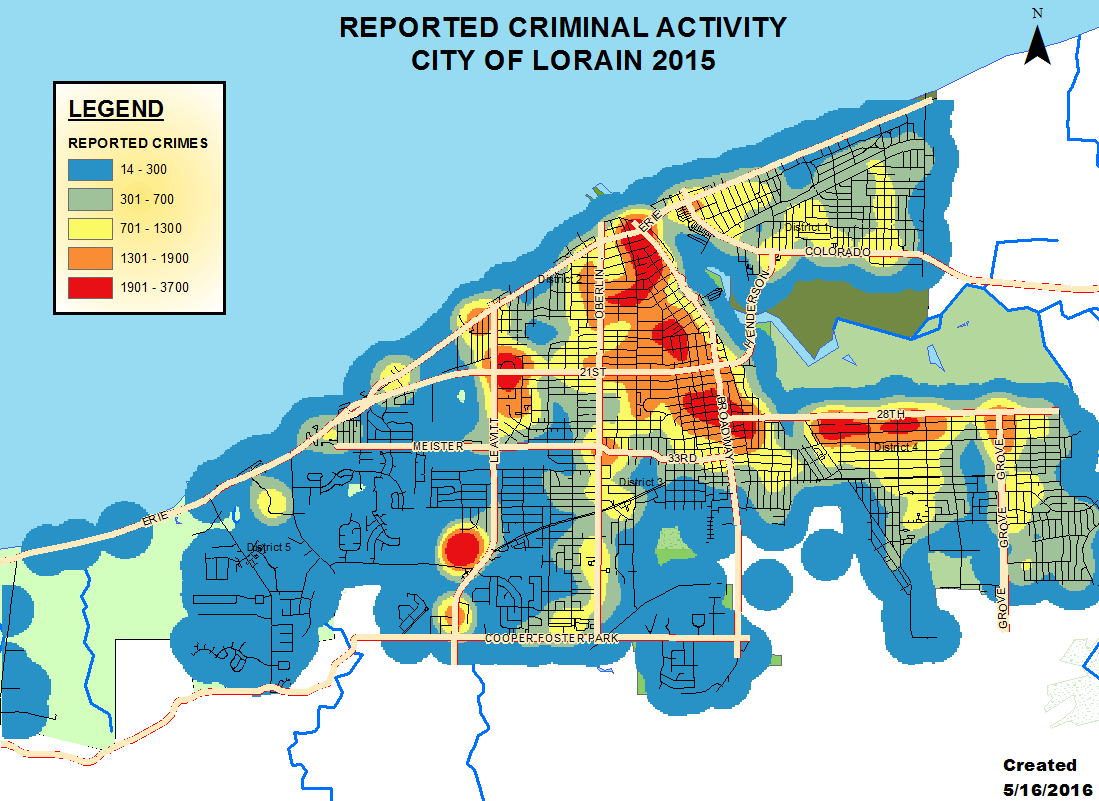
The following map is a “Hot Spot” map of the 2015 offense reports by police in the City of Lorain. Think of it like a weather map:  The redder an area is depicted, the “hotter” that area was with reported activity.  The bluer the area, the “cooler” the area was with reported activity.

This map does not represent offenses per population, but rather the frequency of offenses in specific geographical areas. Rather than just Part I crimes, offenses reported include most reports filed with the police, ranging from minor of offenses to homicide.